Energy

Section four

Energy

Download

Section four | Energy

Introduction

Energy is expected to account for about 28% of total core infrastructure investment over the coming 15 years, or around US$25 trillion (see Figures 3 and 4). Energy efficiency investment adds nearly this amount again, if not more.1

Building sustainable energy infrastructure provides a triple win: it boosts growth, reduces air pollution and greenhouse gas emissions, and expands and improves energy access. It helps avoid the risks of high-carbon assets, and plays a key role in building resilience and overcoming poverty.

Yet a great deal of unsustainable infrastructure continues to be built. Worldwide, the equivalent of 1,500 coal plants are estimated to be in construction or are planned.2 The public sector accounts for more than half of investment in coal-fired power.3 And the risk of stranding is significant: globally, an estimated US$1.1 trillion of current energy-sector assets, particularly coal mines, may be stranded in the transition to a low-carbon economy.4 From a human health and environmental perspective, there may be an even greater risk if the power plants continue to go ahead, namely, that the political economy around vested interests could lock in business-as-usual energy production, even where it is economically suboptimal.

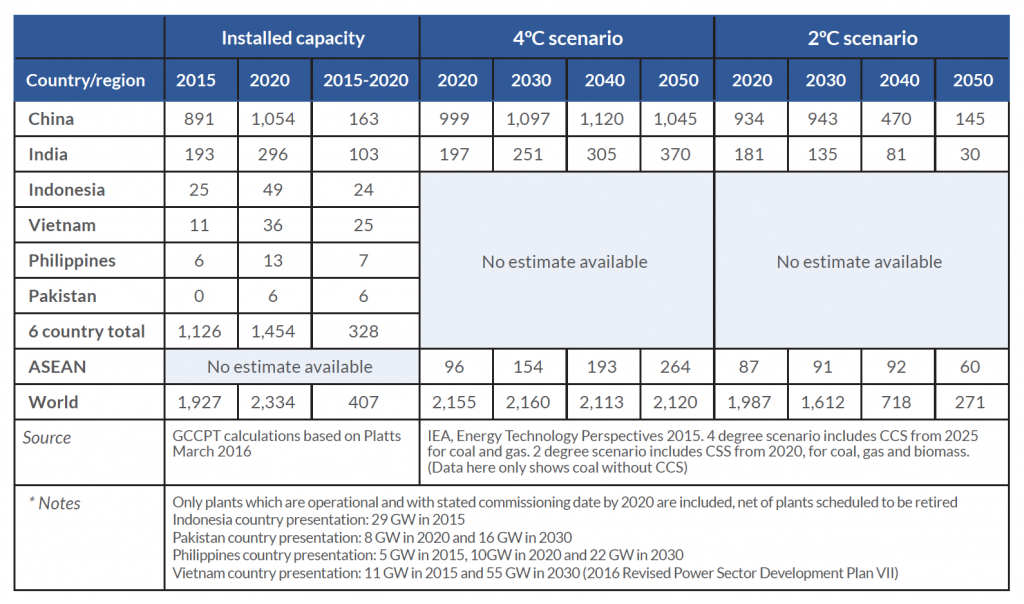
More than 80% of the new coal power plants due to start operation between 2015 and 2020 are in just six Asian countries: China, India, Vietnam, Indonesia, the Philippines and Pakistan (see Table 3). China and India are expected to together account for two-thirds of new global capacity to 2020. If all these plants are built, they would lock in over their lifetimes a significant share of the global carbon budget that the world cannot exceed if it is to reliably meet the 2°C goal5 and would surpass the International Energy Agency’s (IEA) projected sector capacity constraints for fossil fuel power generation (see Table 3).

Table 3

Installed capacity (GW) of coal-fired plants without carbon capture and storage in select Asian countries and its compatibility with climate stabilisation targets

Source(s)

World Bank Group GCCPT calculations based on Platts UDI World Electric Power Plants Database (March, 2016) and on ‘International Energy Agency, Energy Technology Perspectives 2015.6

Replacing fossil fuel energy sources and building new clean energy systems on a large scale requires system-level innovation, including new technologies for energy efficiency and demand-side management. We need not only renewable energy capacity, but also ways to manage the intermittency of wind and solar PV generation, including energy storage and “smart grid” infrastructure. The sustainable energy infrastructure required will vary by country and shift over time, but overall, transformative investments are needed in off-grid, distributed clean energy systems; storage, transmission and distribution systems for on-grid renewable energy; and information technologies that support efficiency and flexibility in system management.

Caio Koch-Weser: On the Energy Transition

Investment in energy efficiency is also essential. Energy efficiency is a clean energy solution that is often neglected, yet it is a highly cost-effective way to manage demand and reduce the investment requirements for overall energy supply (see Box 17). In developed countries, energy efficiency is already the biggest source of “new” energy supply.7 Increasing energy efficiency in industry, buildings and transport could achieve up to half of the emission reductions needed globally to peak greenhouse gas emissions by 2020 according to the IEA.8 And it is leading to savings: energy efficiency investments in IEA member countries since 1990 have avoided US$5.7 trillion of energy expenditure, and the IEA esimates further investments could boost global GDP by US$18 trillion by 2035, increasing growth by as much as 1.1% per year.9 Developing countries also have a lot to gain by managing energy demand. For example, India’s 2030 energy demand would be 40% higher in a low-efficiency scenario than in one with very high energy efficiency; the difference is equivalent to India’s entire current usage. Notably, energy efficiency measures are estimated to create up to three times as many jobs as fossil fuel supply investments per dollar of investment.10

Shifting to a sustainable energy system can create a virtuous cycle of low-carbon, climate-resilient growth across a broad range of sectors.11 The first step is to adopt policies to shift investments away from fossil fuels and high-carbon technologies and towards clean energy and energy efficiency. This, in turn, reduces the costs associated with fossil fuels. For example, in the US, coal transportation accounted for 38.8% of total freight tonnage in 2014.12 Implementation of low-carbon growth policies, in the US and globally, would reduce the need for coal transportation, and promote a shift of higher-value freight from road to rail. The reduced need to extract, process and distribute fossil fuels – and to build and maintain related infrastructure – would also yield significant savings that can be invested in supporting low-carbon growth.

Naina Lal Kidwai: On Momentum in Renewable Energy

A key recommendation of the Global Commission’s 2015 report was to scale up commitments by development banks working with governments and the private sector to invest at least US$1 trillion per year by 2030 in clean energy, including energy efficiency.13 Ensuring access to modern energy services is also critical for developing countries, yet recent analysis suggests that development finance is not yet targeting key outcomes such as decentralized energy access.14 Three energy-related goals – on renewable energy, energy efficiency and clean energy access – are embodied in SDG 7 (“ensure access to affordable, reliable, sustainable and modern energy for all”) and championed in the UN Secretary-General’s Sustainable Energy For All initiative (SE4All).15 Energy infrastructure investment needs to reflect these three priorities, tailored to local circumstances. 

There is enough capital in the world to meet sustainable energy infrastructure requirements. The challenge is to ensure that the right conditions – including well-functioning energy markets – are in place to attract it, both domestically and internationally.16 In this section we focus on three core action areas: fundamental price distortions, the lack of investment frameworks, capacities and policies for incentivising sustainable infrastructure, and the need for investment in clean technology and deployment to reduce upfront investment costs.

Box 17 — Financing energy efficiency: barriers and solutions

There are a number of barriers and market failures that drive the gap between potential and current uptake for investment in energy efficiency. One is misaligned incentives, such as the “tenant-landlord” problem, where the landlord might pay for efficiency improvements, but the tenant reaps the benefits of lower energy bills. Others include the lack of upfront capital by relevant parties (e.g. households and small businesses); the complexity, risk and uncertainty associated with these measures; a lack of awareness of the benefits they can deliver; and potential “hidden costs”, such as the effort required to research and install energy efficiency measures.

Financing for energy efficiency may also not be happening at the scale needed due to difficulties in capturing the financial value of investments. Instead of new revenue, these investments generate savings, and unlike new revenue, the savings often cannot be directly measured or isolated.

Moreover, most energy efficiency loans are tied to the creditworthiness of the building owner, meaning financiers have to vet each building owner individually. This increases transaction costs and reduces the supply of external finance. Many energy efficiency investments are not purely for energy efficiency, but are integrated into more general investments, such as in the construction or refurbishment of buildings and facilities. Accordingly, a large portion of energy efficiency investments are made by building owners (households or businesses) from their own resources, not from external financial investors.

The US Property-Assessed Clean Energy (PACE) programmes allow municipalities and counties to form special tax districts known as “Clean Energy Assessment Districts”. PACE assumes the financial risk, making loans to property owners who adopt energy efficiency measures or install small renewable energy systems, with no down payment required. The loans are repaid over 15–20 years by making additional annual payments on property tax bills. PACE saves consumers money by lowering energy costs, and it creates jobs: for every US$1 million spent on PACE projects, 15 new jobs are created, as well as US$2.5 million in economic output.17 The programme in New Jersey, for example, is an investment opportunity of about US$8 billion, capable of creating 85,000 new jobs, while lowering the state’s carbon emissions by 14%.18

Similarly, India’s Energy Efficiency Services Limited (EESL), founded in 2009 and promoted through the Ministry of Power, facilitates the implementation of energy efficiency projects. The largest national project is converting street lights to energy-efficient LEDs, and also providing LED lights to households. EESL is a joint venture of four public entities: NTPC Ltd, Power Grid Corporation of India Ltd, Power Finance Corporation Ltd and the Rural Electrification Corporation Ltd. Over 100 cities have signed up. EESL also provides energy services and offers consulting and expertise to utilities and financial institutions.19

Energy efficiency finance is seeing significant innovation. Financing models have been developed to cater better to the wide diversity of projects and to overcome the range of contextual hurdles they face in different countries. As highlighted in Box 21 below, the EBRD has made particular progress as a development finance institution in providing finance for energy efficiency improvements. Specialised energy efficiency entities, such as energy service companies (ESCOs), could play an increasingly important role in many countries in implementing these models.

There are also a number of high-level initiatives promoting investment by mobilising financial institutions. For instance, the SE4All initiative aims to double the global rate of improvement in energy efficiency by 2030.

Finally, international cooperation can help catalyse the financing and political support to make the necessary advance. The International Partnership for Energy Efficiency Cooperation (IPEEC) coordinates six G20 task groups including one dedicated to energy efficiency finance, which has the aim to enhance capital flows for energy efficiency investments.20

Addressing the fundamental price distortions

Fundamental price distortions are holding back the transformation of energy markets worldwide. Removing these distortions would level the playing field and remove many barriers to investment in clean energy infrastructure and in continued innovation. It would also incentivise greater energy efficiency and promote sustainability in energy systems.

Box 18 — Understanding the full cost of fossil fuels

If countries are to invest in least-cost energy pathways, their planning processes need to account for the full range of costs and benefits of different options. Yet many energy system plans are based on outdated prices for renewable and energy efficiency technologies. They also reflect incomplete assessments of the local costs and benefits, as well as existing price distortions. As a result, many energy system investment plans still prioritise fossil fuels over clean energy.

A crucial cost that is often neglected is local air pollution. The risks to human welfare posed by local air pollution, in terms of economic and social costs, are increasingly well documented and far greater than previously understood.21 Outdoor air pollution, much of which is associated with fossil fuels, is linked to nearly 4 million premature deaths per year.22

China and India both face major challenges. In China, PM2.5 pollution from fossil fuel combustion and cement manufacture has been linked to a median estimate of 1.23 million premature deaths in 2010.23Updated estimates indicate air pollution killed around 1.6 million people in China in 2013, with an estimated 366,000 deaths from coal pollution alone. In India, the air pollution toll in 2013 stood at 1.4 million deaths.24 The problem is so severe that curbing local air pollution has become a policy priority. In Delhi, the local air pollution was so severe in 2015 that doctors were prescribing that patients with serious respiratory problems simply move out of the city.25

In Europe, research by the Health and Environment Alliance has shown that the impacts of coal plant emissions – mainly due to respiratory and cardiovascular conditions – account for more than 18,200 premature deaths, about 8,500 new cases of chronic bronchitis, and over 4 million lost working days each year. Adding emissions from coal power plants in Croatia, Serbia and Turkey, the figures for mortality increase to 23,300 premature deaths per year, or 250,600 life years lost.26

The economic costs associated with the health impacts of air pollution are also significant. Analysis for the Global Commission shows that the health and mortality burden of air pollution can be considerable, amounting to as much as 4% or more of GDP in some countries.27 Recent analysis by the OECD28 has found that globally, if we continue with business as usual, air pollution-related healthcare costs alone are projected to increase from US$21 billion in 2015 (using constant 2010 US$ and PPP exchange rates) to US$176 billion in 2060. By 2060, the annual number of lost working days, which affect labour productivity, are projected to reach 3.7 billion (from around 1.2 billion today) at the global level. The annual global welfare costs associated with premature deaths from outdoor air pollution are projected to rise from US$3 trillion in 2015 to US$18-25 trillion in 2060. In addition, the annual global welfare costs associated with pain and suffering from illness are projected to be around US$2.2 trillion by 2060, up from around US$300 billion in 2015.29 Thus, welfare costs of air pollution that are in the range of a few trillion dollars today are expected to be an order of magnitude higher by 2060, unless we make a major shift in the way we use energy and control air pollution. Considering the indirect costs of air pollution raises the costs even more: roughly doubling the costs of air pollution in the near-term and adding another order of magnitude of costs in the longer term due to a slowdown of economic growth.

Analysis by the IMF on the damages and costs caused by fossil fuels – through impacts such as air pollution, congestion, traffic accidents and climate change – shows that coal has the largest negative impact on human health through the pollution that it causes, and yet coal’s use is pervasively undercharged in terms of fuel taxes and carbon pricing.

Because fossil fuels are such a big part of the problem, replacing them with clean energy options can sharply reduce air pollution. A recent analysis found that doubling renewables in the global energy mix, instead of continuing with business as usual, could save up to 4 million lives annually by 2030.30 Moreover, the IMF estimates that removing subsidies and charging for externalities associated with fossil fuel use could cut global CO2 emissions by more than 20%, and cut premature deaths caused by air pollution by more than half.31

Integrating the full costs of air pollution on human health and productivity into energy and transport investment decisions would also help level the playing field between fossil fuels and clean energy options. For example, in large parts of Southeast Asia, coal-fired power costs as little as US$0.06-0.07 per kWh, but even conservative accounting for air pollution adds US$0.04 per kWh, bringing coal-fired power costs to US$0.10-0.11 per kWh and removing its price advantage over renewable power sources.32

Along with air pollution and CO2 emissions, the damages from the full life cycle of coal include land disturbance, fatalities in extraction and transport and methane and mercury emissions. Factoring all this into estimates of the cost of coal can double or triple its price; for example, in cost estimates based on coal from the Appalachia, in the US these costs add close to US$0.18 per kWh. This makes wind, solar and other forms of non-fossil fuel power generation, along with investments in energy efficiency, economically competitive.

While there are limitations to these estimates, it is clear that air pollution imposes a very serious cost on society, and it must be duly accounted for in economic assessments to avoid making irresponsible investment choices.33 The benefits of reducing air pollution can also be enjoyed in the near term, and accrue locally, mostly to the benefit of the country taking action. Governments should incorporate these cost estimates into the analyses that guide public investment decisions. Regulatory or price-based policies can ensure that the private sector does the same.

Fossil fuel subsidy reform

Fossil fuel subsidies amounted to approximately US$550 billion in 2014. This includes the under-pricing of fuels in many emerging and developing economies amounting to around US$493 billion34 and other forms of support for the exploration, production and consumption of fossil fuels in OECD countries and key emerging economies amounting to more than US$60 billion.35 These amounts represent a reduction from previous years, partly reflecting recent progress in subsidy reform made by a number of countries and partly due to continuing low oil prices.

When uncompensated environmental damage associated with energy consumption is included (e.g. from air pollution, traffic congestion and climate change), as the IMF does, the estimates increase to about US$4.9 trillion in 2013, or 6.5% of global GDP.36

In the last three years, 28 countries have launched or stepped up their efforts to reform fossil fuel subsidies. Reform efforts have gained momentum through international forums such as the G7 and the G20 as well as through Asia-Pacific Economic Cooperation (APEC), with support from leading international organisations such as the OECD, the World Bank, the IEA, the IMF and the Organization of the Petroleum Exporting Countries (OPEC). G7 and G20 members have made commitments to rationalise and phase out “inefficient” fossil fuel subsidies over the medium term. In May 2016, the G7 countries and the EU reiterated their commitment and for the first time set a deadline, encouraging all countries to phase out these subsidies by 2025.37 North American leaders also committed to a phase-out by 2025 when they met in June 2016. The Commission calls on the G20 to also adopt a clear deadline for the phase-out of fossil fuel subsidies.

Many countries have started to voluntarily report subsidies they deem inefficient.38 Some G20 members have agreed to undertake reciprocal peer reviews of their subsidies and progress on reform. China and the US volunteered to go first, and the reports were delivered to the September 2016 G20 Summit. The next rounds will involve Germany, Mexico and Indonesia.39 A similar peer review process has commenced in APEC, starting with Peru in 2014, and continuing with New Zealand in 2015 and the Philippines in 2016. Low oil prices have provided an important opportunity for oil-importing countries to reform consumer subsidies without raising prices for consumers. Indonesia and India, for instance, have taken advantage of low oil prices to accelerate their reforms.

Subsidies to energy and fuel often particularly benefit middle- and high-income households – an IMF review of fossil fuel subsidies in developing countries, for example, found that on average only 3% of gasoline and 7% of diesel fuel subsidies reach the poorest 20% of households,40and the richest 20% of households capture, on average, more than six times more in fuel subsidies than the poorest 20%.41 As such, reforms can be progressive and the savings can be channelled into investments that more directly benefit the poorest and most vulnerable in society, for example through better targeted income support and social safety nets and through investments in pro-poor infrastructure such as off-grid renewable energy solutions and energy efficiency.

Export credit agencies also provide support to fossil fuel production. Between 2009 and 2013, OECD countries’ export credit agencies provided US$9.1 billion to support coal power – 95% of it from just five countries: South Korea, Germany, France, the US and Japan.42 Reform of these arrangements offers another pathway for countries to demonstrate their commitment to phasing out fossil fuel subsidies, for example by restricting preferential terms for new coal power stations, with a timetable for phasing them out entirely, adjusted to different countries’ circumstances.43

Participants in the OECD’s Arrangement on Officially Supported Export Credits recently finalised new rules that move in that direction, with restrictions on official export credits to less-efficient plants. The rules take effect on 1 January 2017 and will remove support for large sub-critical and super-critical coal power plants, but still allow support for smaller sub-critical plants in poorer developing countries and for mid-sized super-critical plants in countries facing energy poverty challenges. Non-government export credit providers are also encouraged to follow the rules, which are subject to review starting in 2019.44

Subsidies to fossil fuels and power generation can take other forms as well. For example, the EU has capacity mechanisms in use to balance supply in the grid given the rising share of power from variable renewables. But capacity mechanisms do not discriminate between dirty and clean sources and may subsidise continued use of fossil fuels. For example, in the UK, such mechanisms transferred roughly US$1 billion over 2014 and 2015 to diesel- and coal-fired power producers.45

Box 19 — Signs of progress in phasing out fossil fuel subsidies

A number of countries have made progress in recent years in reducing or phasing-out their fossil fuel subsidies and support policies, often complemented by more targeted approaches to supporting poor households. There is much that still needs to be done, but some of the recent progress by G20 countries includes:

  • Indonesia has phased out US$15 billion in consumption subsidies. Indonesia almost completely removed most petrol subsidies and made progress in reducing diesel subsidies, saving the public a total of just over US$15 billion in 2015. The increase in prices of gasoline, diesel and electricity were offset by a more targeted US$2.6 billion compensation package for the poor.46
  • Canada is taking action to phase out subsidies, including for tar sands production. Canada is phasing out several subsidies to oil, gas and mining, including ending targeted support to tar sands such that they are now subject to the same tax regime as other oil, mining and gas development. It is also phasing out the Atlantic Investment Tax Credit, which applies to oil, gas and mining.47
  • India is phasing out fossil fuel subsidies and in 2016 doubled its clean energy ‘cess’ on coal. In 2010, the Indian government sought to liberalise the price of petrol, and in 2013 it began a phased deregulation of diesel prices. This has already resulted in a significant decrease in India’s budget deficit, as well as in the share of diesel vehicles in India’s passenger car fleet.48 Other reform opportunities exist, for example to reform kerosene lighting subsidies and to re-allocate savings to offset or eliminate tariffs/VAT on solar lighting products. In January 2015 some important steps were taken: India’s Finance Minister announced a new phase of subsidy reform for LPG and kerosene, combined with an increase in excise duties on petroleum and diesel. In 2016, the Indian government proposed to double the cess on coal, lignite and peat to INR 400 (US$6) per tonne.49 
  • Germany is on track to end coal subsidies by 2018. In 2007, Germany formally committed to phasing out support to its domestic hard coal industry by 2018. To ease this transition, the government provides support for early retirement schemes for those working in coal production and shares the costs of closures and inherited liabilities with the industry to manage the impacts of reform.50
  • Russia is reforming its tax policies around fossil fuel production. Taking advantage of low oil prices, Russia has phased out some tax breaks for fossil fuel producers and Russia’s Ministry of Finance began exploring in late 2015 potential tax increases for oil and gas production and export. Russia has also increased excise taxes on transport fuels.51
  • Saudi Arabia raised fuel prices by 66% in 2016 as part of a wider subsidy reform process.
    The Saudi government raised the price of gasoline by two-thirds, and increased electricity and gas tariffs. The Ministry of Finance indicated in the annual budget statement that subsidy cuts aim “to achieve efficiency in energy use, conserve natural resources, stop waste and irrational use”.52
  • Mexico initiated fuel pricing reforms and introduced a carbon tax in 2013. The government has gradually increased petrol and diesel prices since 2013, and is working to better target energy subsidies in order to bring prices more into line with the true costs. In 2013, the Mexican congress approved the introduction of a carbon tax, and approved increases in the retail price of petrol and diesel through to 2017, in line with overall inflation. It is projected that from 2018, petrol prices will be liberalised and determined by the market.53
  • Brazil raised prices of transport fuels in 2015.54 
  • The US and France restrict international public finance for coal. The US export credit agency was one of the first to significantly curtail support for coal-fired power plants, and its Overseas Private Investment Corporation (OPIC) has shifted its financing away from fossil fuels and towards renewable energy. Guidelines from the US Treasury restrict US support for multilateral development bank funding of coal-fired power projects.55 France’s overseas development agency and export credit agency no longer support coal-fired power stations without carbon capture and storage.56

Pricing carbon

For the market to reflect the full costs of GHG emissions from burning of fossil fuels, countries should introduce meaningful and rising carbon prices in tandem with subsidy reform.57 As noted in Section 2, around 40 countries and 20 cities, states and regions, have implemented or scheduled an explicit price on carbon, covering an estimated 7 Gt CO2e, or about 13% of annual global greenhouse gas emissions.58 This is triple the coverage of a decade ago.

Momentum continues to build. China plans to implement the world’s largest emissions trading scheme next year, expanding its current 7 pilot trading systems to the national level. The French government has indicated it will seek to legislate a carbon price floor of €30 (US$33) per tonne of CO2;59 it has also adopted a carbon tax on transport, heating and other fossil fuels.60 In July 2016, Canadian Environment Minister Catherine McKenna called for a national carbon price by the year’s end.61 This came on the heels of the approval of a cap-and-trade system in Ontario in May 2016, with the first auction to be held in March 2017 and a plan to link to Quebec and California’s joint carbon market in late 2017 or 2018.62

However, carbon prices are generally too low: less than US$10 per tonne CO2e for about three quarters of covered emissions.63 This is not enough to bring about transformative change. Still, the Paris Agreement has shifted expectations. A recent survey of members of the International Emissions Trading Association (IETA) found that 82% of respondents expect carbon markets to grow because of the Agreement.64 They also suggested that achieving the Paris goals would require a carbon price of US$45.

Through the Carbon Pricing Leadership Coalition (CPLC), meanwhile, governments, industry leaders and international organisations are working together to increase knowledge on how to design and implement successful carbon pricing systems.65 As part of this effort, the World Bank, the OECD and the IMF have developed a set of principles for successful carbon pricing, based on lessons from carbon pricing experiences around the world. The CPLC is supported by a Carbon Pricing Panel, made up of sitting leaders of countries that have already taken action on carbon pricing and are personally advocating for other leaders to follow.66 Given the critical importance of doing away with perverse subsidies and pricing carbon properly, the Global Commission welcomes the emerging coalitions of governments, investors and businesses – including through the CPLC and the G20 – that have the potential to accelerate action globally on fossil fuel subsidy reform and carbon pricing, including by highlighting evidence of good practice and building multi-stakeholder partnerships for reform.

Beyond carbon taxes and emissions trading, another way that countries are pricing carbon is through fuel taxes more broadly, in particular transport taxes, which are generally already widely accepted.67 For example, Vietnam adjusted taxes, including on transport fuels, to better reflect carbon content, and thereby boosted investment and domestic demand for goods and services.68 Transport fuel taxes, however, may reflect a range of externalities beyond climate change, including congestion, road damage and local air pollution. A tax that reflects all of this will be higher per unit of fuel than if only taxing carbon content. However, current transport and energy taxes generally do not reflect the full social costs of the use of these fuels. Recent analysis shows that OECD countries inconsistently tax different forms, uses and users of energy relative to environmental and other social costs.69 Of particular note is that there is often a very low or zero tax rate on coal, despite its greater contribution than other fuels to GHG emissions and air pollution per unit of energy. In all but the US, the tax on diesel in OECD countries is lower than the tax on petrol, despite diesel’s much higher air pollution impacts (see also Box 24 in Section 5). Adjusting fuel taxes is a low-cost opportunity for reforms to ensure, where possible, that tax rates reflect the external costs associated with different forms of energy and energy use.

Other policies, such as fuel standards or feed-in tariffs, may be warranted if they tackle specific market failures or political or behavioural barriers that explicit carbon prices do not. These create an implicit price on carbon associated with compliance by industry and consumers. Enforcement measures are an essential part of the policy framework to ensure the implicit price is felt. Every climate policy that regulates carbon can be expressed as a marginal cost per tonne of emissions reduced, which is equivalent to a carbon price. In many countries, the implicit carbon price associated with policy instruments is much higher than explicit carbon prices.70

Strengthening investment frameworks, institutional capacity and policies

This includes planning, public investment management and policies to improve the enabling environment for private investment in sustainable energy infrastructure.

National strategies for sustainable energy infrastructure − policies, planning and public investment management

Countries need to articulate a clear and comprehensive national strategy for sustainable energy and related infrastructure, and embed it in an overall policy strategy for sustainable and inclusive growth and development. Such planning is particularly important in developing countries, where national development plans are used to guide development cooperation and the allocation of official development assistance (ODA).

A key part of this is aligning national investment and climate policies, and enhancing the coherence and predictability of policies that affect broader investment frameworks. Ideally, a single integrated strategy for low-carbon, sustainable development should map to sector plans, national and subnational planning to guide investment. Importantly, this also helps prepare a project pipeline and incentivise private investment in clean energy infrastructure.

The development of dedicated energy transition plans can dramatically accelerate the shift to a clean energy mix, in a way that delivers clean and resilient energy access. The Global Commission calls on all countries to develop transition plans to accelerate a scale-up of clean and resilient energy solutions and a phase-out of coal, in a way that delivers on energy access goals and facilitates a “just transition” for workers. The Global Commission welcomes the establishment of a Just Transition Centre that is initiated by the International Trade Union Confederation (ITUC) with emerging partnerships with business and civil society, focused on dialogue between governments, employers, workers and civil society around how to ensure a “just transition” towards including at national and sectoral levels.

A comprehensive domestic investment policy framework needs to cover the full range of policy fields that are critical for creating an enabling environment for clean energy investment, including investment promotion and facilitation, trade, competition and tax policy; corporate governance, policies for enabling responsible business conduct and public governance; and issues relevant to finance and financial markets policy.71 Ensuring that such a framework leads to green investment requires specific policies and measures. In particular, environmental considerations must be appropriately integrated into investment decisions, for instance by agreeing on and applying a standard for assessing the life-cycle emissions and climate vulnerability of energy infrastructure investments to ensure they align with long-term climate goals. The culture and incentives for financiers has started to change but will need to go further to prioritise and value more sustainable long-term investments over a narrow focus on short-term gains.

The OECD has proposed a non-prescriptive checklist for clean energy investment policy frameworks, with the aim to strengthen investor protection and transparency, avoid discrimination, ensure stable and predictable incentives and avoid policy uncertainty, strengthen competition policy and electricity market design, and enhance public governance of energy systems.72 Policy reforms will also be required to create incentives for new business models to emerge, for example for integration of centralised and decentralised energy, wireless platforms for customer services and payments, and connecting utilities functions with small and medium size enterprises to provide energy services including energy efficiency.

Several countries are already reforming their domestic investment policies to support low-carbon and climate-resilient investments. For example, Colombia is working to mainstream climate action across its national development plan and, amongst other proactive measures, has established a focused programme on public-private collaboration, with priority attention to investment in infrastructure and achieving environmental sustainability. It has also put a range of fiscal incentives in place for investment in low-carbon technologies.73 Jordan is aggressively pursuing policy reforms to scale up clean energy investment, including in energy efficiency.74 In the new 2015 Arab Future Energy Index, Jordan ranked second for renewable energy trends and third for energy efficiency.75 

However, capacities in the public sector in developing countries for sustainable energy investment planning and undertaking necessary policy reforms are often weak and urgently need to be strengthened. Even where capacity is higher, little attention may be paid to sustainability. Appropriate technical, legal and financial skills, both inside and outside government, are frequently lacking. When these skills are present, within the government or through consultants, projects are likelier to be prepared and reach financial close and implementation without costly delays.76

Building such institutional capacity and setting in motion relevant policy reform processes has a cost, takes time and cannot succeed without high level commitment and leadership from the government. It likely entails staff training, data collection and analysis, changing legislation and regulations, and capacity for enforcement. In developing countries, external support can play a pivotal role to help deliver enabling policy reforms and to strengthen capacity to finance sustainable infrastructure. For example, ODA, particularly where it can be programmed in across multiple years to ensure continuity, can help to fill the financing gap in this area for poorer developing countries.

Meeting large sustainable energy infrastructure needs will require determined efforts to tap any available scope for additional domestic resource mobilisation through tax and expenditure policies. It will also require better use of government balance sheets. Given the significant potential for private investment in the clean energy space, a key focus of public-sector investment should be to catalyse private finance – and to fill gaps where the private sector is unlikely to step in.

There are several ways to mobilise public resources for clean energy and other purposes, including by removing excessive and regressive tax exemptions, taxing GHG emissions and other externalities, removing fossil fuel subsidies, and adjusting fuel taxes. For example, revenue from the Indian government’s Clean Environment Cess, effectively a tax on coal of about US$6 per tonne (INR 400), raised about US$1.9 billion (INR 13,000 crores) for the National Clean Energy Fund by 2015, financing research and innovation.77 Similarly, the strain of large fossil fuel subsidies on the Nigerian budget prompted the Nigerian government to make efforts to reform electricity subsidies in 2008 (through a 15-year plan to achieve cost-reflective tariffs), followed by petrol in late 2011, thus generating a double win by aligning incentives for a low-carbon economy and creating more fiscal space for public spending.78

Tax revenues relative to GDP are much lower in emerging and developing economies than in advanced economies, so there may be considerable scope for greater revenue mobilisation through tax reform and tighter tax administration. Improved taxation has many benefits, including establishing a revenue base for further investment and strengthening the public balance sheet.

As part of public investment management, it is in governments’ self-interest to improve procurement principles and practices, and devise means to integrate sustainability parameters, particularly at the sector level in the case of energy (see Box 20 for examples).

Box 20 — Sustainable procurement for clean energy infrastructure: Italy and South Africa

Sustianable procurement is a way to shift public finance into clean energy and build markets for clean energy technologies and services. For example, this has occured in Italy through Consip, which is the central purchasing body, wholly owned by the Italian Ministry of Economy and Finance. It set out to improve the procurement of heating services, which accounted for 41% of national energy expenditure (about €3.4 billion [US$3.7 billion] annually) and about 5% of the Italian energy market. Consip’s goal was to save 5–10% in energy use and costs through energy performance contracts.79

The agency conducted a thorough market analysis, including a consultation through online surveys addressed to businesses and the main trade associations in Italy. Suppliers were invited to provide input on Consip’s planned approach. The result was a framework contract, open to all public administrations, that includes improved energy efficiency, consumption reduction and CO2 emissions avoidance. The idea was to motivate suppliers to optimise energy consumption and resource management to improve their profitability. The initiative saved public administrations 27% on contracts worth about €800 million (US$880 million), covering about 6,000 buildings.

Another example is South Africa’s Renewable Energy Independent Power Producer Procurement Programme (REIPPPP), which replaced feed-in tariffs for renewable energy.80 The REIPPPP has successfully channelled substantial private-sector expertise and investment into grid-connected renewable energy in South Africa at competitive prices. The first three bid rounds, held over 2.5 years, attracted a wide variety of domestic and international project developers, sponsors and equity shareholders. A total of 64 projects have been awarded to the private sector, with more than 100 entities participating in the contracts. Banks, insurers, DFIs and even international utilities are involved. Notably, 86% of the debt finance has been raised within South Africa. The first projects are already operating, and investments totalling US$14 billion have been committed, to generate nearly 4 GW of renewable power. Over the three rounds, average solar PV tariffs decreased by 68%, and wind by 42%, in nominal terms.

REIPPPP demonstrates that private sponsors and financiers are more than willing to invest in renewable energy if the procurement process is well-designed and transparent, transactions have reasonable levels of profitability, and key risks (programme design, programme management and market risks) are mitigated. REIPPPP also highlights the need for effective programme champions with the credibility to interact convincingly with senior government officials, effectively explain the program to stakeholders, and communicate and negotiate with the private sector.

Strengthening local finance institutions

There is an increasing recognition of the role that local financial institutions (LFIs) play in promoting private investment in sustainable infrastructure, including energy efficiency. These can be commercial or public entities; for the latter, a key role is to catalyse engagement with commercial banks.

LFIs have unique competitive advantages for driving the uptake of sustainable investment solutions, including in-depth knowledge of local markets, a good understanding of customers’ demands, tailored product offerings for local requirements and an ability to provide financing in local currency. However, several barriers to the deployment of green finance through LFIs hold back their potential to drive investment, in particular perceived or actual high risks of sustainable low-carbon projects, low risk appetite by banks and low availability of long-term finance.81

These barriers can be addressed by building internal knowledge, awareness and capacity within local banks; fostering changes in their internal culture; sharing knowledge among LFIs; and appropriately accounting for, documenting and pricing the benefits of green investments. Governments can implement policy and regulatory reforms to support this shift. MDBs can play a role in finding solutions at the regional level, by connecting LFIs with green finance resources, providing technical assistance, raising awareness and fostering collaboration.

One area in which LFIs play an increasingly active role is in financing energy efficiency investments in their own countries. They are typically active in sectors where market failures are well known and have substantially limited private sector investment. Two examples in Europe are:82

  • Germany’s KfW “Energy Efficient Construction and Refurbishment” programme provides concessional loans and grants for energy-efficient construction and refurbishment activities in the German residential sector. To qualify, projects must achieve greater efficiency than is required by the German Energy Savings Ordinance. In 2013, KfW invested €4.1 billion (US$4.5 billion) in residential retrofits. Between 2006 and 2013, it has provided more than €50 billion (US$55 billion) in loans and grants covering 3 million housing units.
  • The European Energy Efficiency Fund (EEEF) is an innovative public-private partnership, which acts as a risk-sharing facility, working with financial institutions to provide market-based finance to local authorities and energy service companies for commercially viable energy efficiency, renewable energy and clean urban transport projects related to public-sector activities across the EU. It contributes with a layered risk-return structure to enhance energy efficiency and foster renewable energy in the form of a PPP, primarily through the provision of dedicated financing via direct finance and/or partnering with financial institutions. Deutsche Bank acts as the fund’s investment manager, sourcing, evaluating and preparing proposals, but final decisions about investments are made by the fund’s governing bodies. By the end of 2015, ten projects have received financing of almost €117 million for projects worth a total of almost €220 million. These have generated CO2e savings of 181 Mt and primary energy savings of 20 GWh.83

Catalytic use of domestic and international public development finance

Domestic and international public finance can be catalytic in attracting private finance at the scale required. Deployed at the right time, at the early stages of infrastructure projects, public investment can drive the global clean energy revolution. National or subnational planning, with clearly established priorities, can be effective in guiding such investments.

As discussed in Section 2, national development banks (NDBs) are increasingly active and have the potential to grow their activities in sustainable energy infrastructure by creating or expanding green banking “windows”. Green investment banks, essentially NDBs with a green mandate, are also increasingly being established, in particular where countries do not have an NDB (see Section 3). The creation of a green banking window or a green investment bank can signal to domestic and international markets that a country or region is seeking to become a leader in scaling up private low-carbon investments.84

In Mexico, for example, Nacional Financiera (NAFIN) is a key local partner in the implementation of the government’s low-carbon development strategy and in accelerating private investments in low-carbon technologies. The Renewable Energy Financing Facility (REFF) was established within NAFIN to fill the financing gap for sustainable infrastructure by providing direct loans to renewable energy project developers, with maturities in the 10- to 15-year range and fixed interest rates. The fund also offers contingent credit lines to cover transitory cash-flow shortages during the project life cycle, up to the volume needed to service senior debt.85

Recent analyses confirm the need for energy-sector investments on the scale of about US$1 trillion per year, as previously recommended by the Global Commission.86 For energy efficiency alone, if development banks, bilateral aid organisations, and climate finance organisations dedicated US$10–15 billion a year to finance sustainability premiums for energy efficiency, this could leverage private capital that could increase the value of energy-efficient infrastructure by up to US$176 billion a year.87 Over 15 years, that means there would be US$2.6 trillion in sustainable energy-efficient projects that would have not otherwise have been built sustainably.88

One example of a successful partnership to promote energy efficiency is Commercialising Energy Efficiency Finance (CEEF), a risk-sharing programme of the International Finance Corporation (IFC) and the Global Environment Facility (GEF) that provided guarantees to investments in Eastern Europe.89 Another is the China Utility-Based Energy Efficiency Program (CHUEE), which has provided US$512 million in loans to 78 companies without a default loss and is now scaling up by partnering directly with medium-sized financial institutions in China.90 A third is the European Bank for Reconstruction and Development (EBRD) Sustainable Energy Initiative, a strong example of the role DFIs can play in promoting energy efficiency and renewables (see Box 21).91

Another potential source of innovative or catalytic climate finance is the Green Climate Fund’s (GCF) private-sector facility. Although it has not yet disbursed any funding, it has approved eight innovative projects spanning adaptation and mitigation and engaging with a variety of partners from both the public and the private sector, and more projects are expected to be approved in the coming year.92 One example, already approved for funding, is the KawiSafi Venture Fund for East Africa, an initiative of Acumen, a non-profit impact investment organization.93 The fund will work with clean energy companies to deliver climate change mitigation, adaptation and local development benefits, starting in Rwanda and Kenya. Acumen will directly invest US$5–7 million and hopes to use seed funding from the GCF to catalyse investment to grow the fund to US$100 million.

Box 21 — EBRD Sustainable Energy Financing Facilities (SEFFs)

In 2015, the EBRD launched its Green Economy Transition (GET) approach, which combines green investments with technical assistance and policy dialogue – a proven business model. Under the GET, the EBRD reaches small- and medium-sized businesses, corporate clients and retail clients through Sustainable Energy Financing Facilities (SEFFs) by extending credit lines to local financial institutions which, in turn, lend funds to their clients.94

SEFFs provide financing for key types of sustainable energy projects, including energy efficiency and renewable energy; others finance resource efficiency investments that optimise water and material consumption and minimise waste. EBRD has also developed a SEFF to support investments that improve the resilience of clients’ businesses to the effects of climate change.

SEFFs are accompanied by technical assistance in the form of a programme support team. This team provides expert guidance to partner financial institutions on designing financial products for green projects. In addition, the team supports partner banks with marketing and promotion, training bank staff and monitoring the development of these new business areas. The team also helps end-borrowers turn project ideas into bankable green investments.

Since 2006, cumulative EBRD financing of SEFFs has reached more than €3.4 billion (US$3.7 billion) in over 100,000 sub-projects. The EBRD now works with more than 100 partner financial institutions in 24 countries, including large international banks and small banks in Central Asia and the Caucasus. The SEFF portfolio of projects is estimated to avoid more than 6 million tonnes CO2e of emissions per year. SEFFs play an important role in developing new green financing markets, from significant renewable energy or industrial energy efficiency projects, to very small residential energy efficiency investments, and by setting an aggregation frame. Some examples are:

The €585 million (US$642 million) Turkey Private Sector Sustainable Energy Finance Facility (TurSEFF) provides credit lines to local financial institutions to lend to the private sector for energy efficiency and small-scale renewable energy investments. Since TurSEFF’s launch in 2010, partner banks have financed 13 landfill gas power plants for a combined amount of €15 million (US$16.5 million). Over half of the facility’s GHG reductions now derive from methane abatement in landfills. TurSEFF has also financed energy efficiency improvements in businesses, and wind, solar and hydroelectric power. Arel Cevre, for example, received a loan of €0.7 million (US$0.8 million) under TurSEFF to fund a 2.83 MW landfill gas power plant in Isparta, Turkey. The new plant is expected to produce on average 21.06 GWh of green electricity annually and has a payback period of 1.7 years. It is anticipated to generate average net revenues of €2.3 million (US$2.5 million) per year from electricity sales.

The €60 million (US$66 million) Western Balkans Sustainable Energy Financing Facility (WeBSEFF) has extended credit lines to eight partner banks in the Western Balkans to lend to businesses and municipalities investing in sustainable energy projects. For example, this helped a Macedonian sweets producer obtain €970,000 (US$106,000) in EBRD financing via Ohridska Banka. The project is expected to reduce the company’s energy consumption by more than 30% and improve overall efficiency. As a result, the company expects to save €262,000 (US$287,000) per year, representing a payback period of 3.6 years. Its CO2 emissions are expected to decrease by 490 tonnes per year.

Emerging role for philanthropic and impact investors particularly in off-grid solutions

Philanthropic and impact investors help bridge the gap between patient capital and venture capital, and can be transformative in scaling up sustainable energy investments, especially in low-income countries. This is where equity impact investments play a key role, especially with off-grid technologies. Not only are impact investors usually more patient with capital, but equity investments do not require collateral.

For example, several impact investors have funded Fenix International, a venture-backed California company focused on expanding energy access in developing countries through renewable technologies. The company’s ReadyPay Power enables customers to purchase the system in micro-installments that fit their income, using their mobile phones to pay as little as US$0.25 per day. ReadyPay helps low-income people overcome financial barriers to access to clean energy, and enables them to power lights, phones, radios and appliances. The programme recently won the Development Assistance Committee Prize for Taking Development Innovation to Scale after providing paid power to more than 22,000 households in Uganda, benefitting over 136,000 people.95

In rural Kenya, Vulcan Impact Investing owns 10 solar-powered micro-grids that serve 21,000 people, operated in partnership with SteamaCo.96 Not only does this replace energy from harmful sources such as kerosene and diesel, but it also provides a sustainable energy source to drive economic activity. Several off-grid companies that started with impact investing have attracted larger-scale commercial investment, such as M-KOPA in Kenya and Mobisol in Tanzania. Through M-KOPA, nearly 400,000 customers in Western Africa have made a small deposit for a home solar system, then paid the rest of the balance back through a widely used mobile banking service based on the amount of energy they use.97 Mobisol, a Berlin-based company offering customers in low-income countries solar home systems via affordable installments made from mobile phones, has installed 50,000 solar home systems to date in households and businesses in East Africa, which have allowed its 250,000 beneficiaries to access clean, affordable energy.98 These examples confirm the role of philanthropic and impact investors as those who can help catalyse investment, not just in off-grid renewables, but in new sustainable technologies more generally.

In India, where access to debt capital is generally low, off-grid companies face prohibitively high interest rates of 13–18% in the domestic market. Local banks are usually unwilling to lend to them, as the loans are too small, and international debt is also out of reach due to regulatory requirements. Therefore, most investments in off-grid energy – ranging from US$100,000 to US$5 million – have been from equity impact investors and development banks.99 Examples include Firstlight Ventures investment in Promethean Power Systems, Anthro Power and Excellent Renewable, and Ennovent’s investment in Barefoot Power. However, impact investors can find it difficult to access the Indian market, especially as they may have a hard time approval from the Reserve Bank of India to lend in the Indian market. 

Tailored instruments to attract private investment: project preparation and construction

Private finance is best suited to the operational phase of sustainable infrastructure investment, but there are good opportunities to bring in private finance during project preparation and construction as well. Tailored instruments that manage the challenges of this phase, especially those related to risk-return profiles, are critical. Options include turnkey contracts, construction guarantees, targeted credit enhancements, availability payments, mezzanine financing to first-loss protection, partial risk guarantees against policy risk and exemptions from reserve requirements.

Public finance can also be used to blend concessional and non-concessional finance from public and private sources for project preparation or construction. Blended finance is the strategic use of official development finance to mobilise additional public or private finance. This may be needed to finance the upfront premium for sustainable infrastructure projects and to draw in private finance and investors.

DFIs can play a pivotal role here in pioneering and scaling up use of blended finance creating viable and replicable financing models. In addition to use of official finance for guarantees or insurance, syndicated loans or project bonds also provide a means for co-investing across public entities, such as local banks, NDBs or MDBs, and can also attract private investors to the early project stages.

DFIs – multilateral, bilateral and national – can come in at the early stage to help with project preparation and construction and draw down the costs for the private sector. A few examples of such strategies include:

  • The Central Bank of Lebanon (BDL) reduces the cost of financing investments in specific economic sectors by exempting banks from part of the required reserve requirement. BDL is working with the Ministry of Power, the United Nations Development Programme (UNDP), the EU, and the Lebanese Center for Energy Conservation (LCEC) to provide low-cost finance and medium- to long-term maturities to potential investors in green technology, specifically in energy efficiency and renewables. BDL, UNDP and LCEC have agreed to develop a vehicle to finance energy efficiency and renewable energy, called NEEREA (National Energy Efficiency and Renewable Energy Action), and will work with international donors and organisations to support NEEREA, and to raise awareness and build capacity among Lebanese commercial banks and consumers.100
  • The Clean Energy Investment Accelerator (CEIA) seeks to develop a network of blended capital facilities that will provide early-stage working capital to renewable energy and energy efficiency project developers in emerging markets, at below-market interest rates. The CEIA is a revolving loan facility developed by Alotrope Partners that leverages philanthropic and other sources of concessionary capital (government and multilateral), alongside private equity and debt, to fill critical gaps in clean energy finance. It targets early-stage project preparation, clean energy business development and the demonstration of new low-carbon technologies.101
  • MDB guarantees: The targeted application of MDB guarantees can make or break large-scale infrastructure projects. Such was the case with the €625 million (US$685 million) Lake Turkana Wind Power Project (LTWP), whose success depended on a €20 million (US$22 million) guarantee from the African Development Bank (AfDB) and Standard Chartered Bank. LTWP aims to provide 310MW of reliable, low-cost wind power, around a 10-15% increase in Kenya’s total installed capacity of around 2,300 MW. The LTWP site is more than 428 km away from the nearest substation, so a transmission line must be built to deliver the power to the national grid. The state owned Kenya Electricity Transmission Company (KETRACO) agreed in 2013 take responsibility for the US$185 million transmission line, which was critical to the success of the wind farm. After the World Bank withdrew its partial risk guarantee in late 2012, the project was delayed for more than two years—a real-life demonstration of the integral role of guarantees in bringing projects to completion. At the end of 2014, the AfDB and Standard Chartered stepped in with guarantees to cover loss of revenue attributable to transmission line delays. Construction began in 2015 and is expected to finish in 2018. “By reducing the risk profile,” noted the AfDB, “the partial risk guarantee will accelerate financial closure and reduce the overall cost of capital to the project.” In effect, by reassuring investors, this €20 million guarantee is helping the project reach its €625 million financing target.102
  • The UNDP has created a de-risking renewable energy investment methodology to reduce and, where possible, remove a range of policy, legislative, regulatory, institutional, financial, and awareness barriers that inhibit investments in sustainable energy at national and local levels. Together with technical assistance associated with financial instruments, these public de-risking instruments create favorable conditions for private sector involvement and are able to catalyze large-scale investments. Early results are promising. In Tunisia, for example, UNDP, with financing from the Global Environment Facility, is supporting de-risking measures that are predicted to leverage US$1 billion (€935 million) in private sector investment, and to significantly lower the cost of solar power for consumers.

Given the increasingly commercial viability of solar technologies, it is also now possible to attract private capital on its own to eary stages of project development in some markets. Wunder Capital is an innovative example of this for small solar projects in the US. It is a financial technology company that develops and manages solar energy investment funds. There was a gap in the market for smaller project funding, as transaction costs are prohibitively high for lenders; any deal under US$2 million can cost more to prepare than the expected loan revenue. To overcome this, Wunder is structuring diversified funds that hold solar project assets, then marketing them to specific institutional investor classes, thus accessing private capital for early stages of solar projects.103 Wunder just launched a bridge fund that issues asset-backed project loans to the US solar industry and is expecting to deliver a return of up to 11%. As the minimum threshold for investment is low, there is also potential for crowdfunding with this type of business model.

Tailored instruments to attract private investment: operating phase

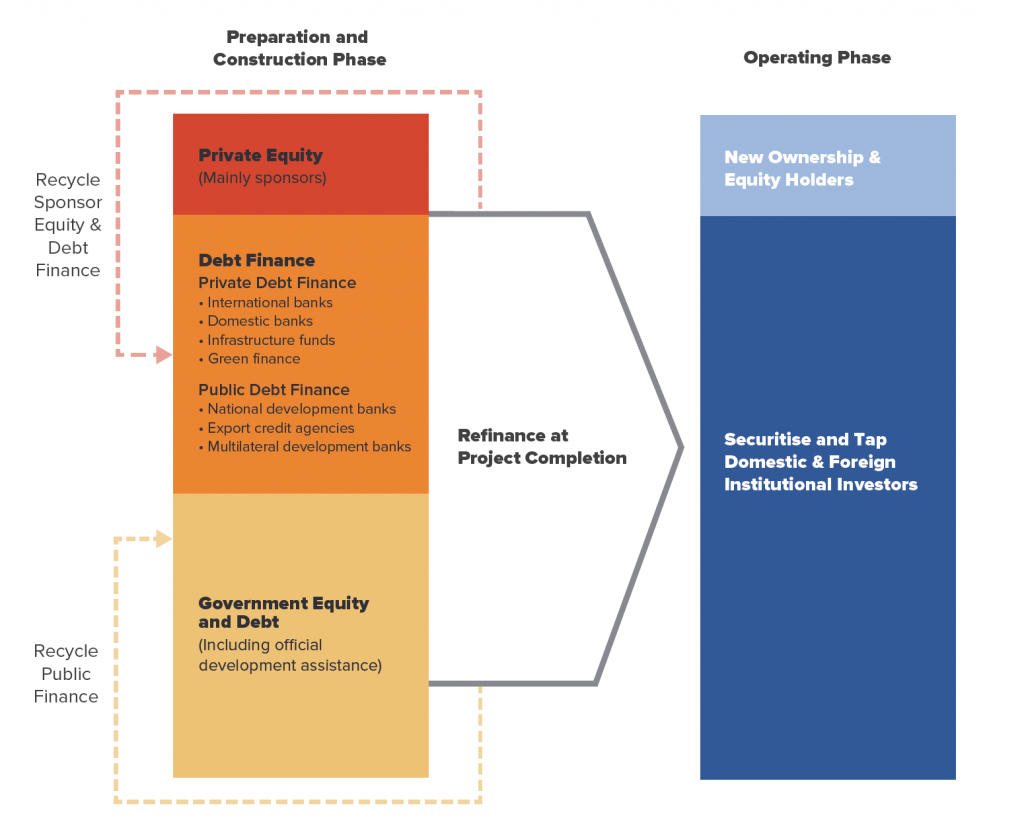
The generation of more certain cash flows in the operating phase opens up the prospect of replacing bank debt with bond finance that can be held by both domestic and foreign institutional investors: pension funds, insurance companies, private equity and sovereign wealth funds. This refinancing allows for a recycling of equity and bank finance that can be used for new investments (see Figure 10). In the operational phase, a key approach is securitisation of infrastructure loans once there are reliable, operating revenue streams, where the use of labelled green bonds or YieldCos provides a way to achieve this. Both green bonds and YieldCos can be used to develop infrastructure as an asset class to attract institutional investors (see discussion in Section 3).

Figure 10

Infrastructure Financing Requirements for Emerging Markets and Developing Countries

Source(s)

Bhattacharya et al., 2016

Green bonds can be used to attract private capital and, in particular, long-term finance to sustainable infrastructure markets. They are especially attractive once the investment is operating, hence avoiding risks associated with preparation and construction phases. Green bond markets are expanding and diversifying rapidly. The amount of green bonds for sustainable infrastructure has quadrupled or more since 2012, reaching US$42 billion in 2015.104 The Climate Bonds Initiative and HSBC expect the labelled green bond market to rise to US$100 billion of green bond issuance in 2016, and estimate the total market currently at US$118 billion outstanding.105

Bonds are familiar instruments for the investment community, but there are concerns around the credibility of green bonds. Measures to tackle these issues need further coordination and work (see Section 3). Several factors are likely to drive continued rapid growth of green bond markets, but government policy is needed to ensure the potential of this market is fully realised and barriers do not get in the way.106

Box 22 — Case studies on green bonds

In India, the first corporate green bond was issued by Yes Bank in February 2015. The US$161.5 million (INR 10 billion) bond will finance renewable energy projects. Following the success of the Yes Bank issue, the Export Import Bank of India issued a larger US$500 million green bond. The green bond will finance renewable energy and transport projects. India was first of the biggest emerging economies to issue green bonds, ahead of China.107

China is now a leader in the labelled green bond market – the largest country of issuance to date in 2016. It has announced it will issue US$46 billion of labelled green bonds in 2016.

The BRICS New Development Bank, founded by Brazil, Russia, India, China and South Africa to finance sustainable development in emerging markets and developing countries, commenced operations in 2016. It has already made several loans; its first bond issue will be five-year yuan-denominated green bonds, and will be used to finance sustainable energy projects. Its first loans are US$300 million to Brazil, US$81 million to China, US$250 million to India and US$180 million to South Africa: all are on renewable energy.108 Future bond issuance could be in local currencies to help local investors avoid exchange rate risk.

There is a role for the public sector to create and develop a market for green bonds to tap into investor demand and ensure the market meets its potential.109 To facilitate the market, common standards for green bonds should be agreed internationally.

In addition to stronger and uniform standards (see Section 3), a number of factors could help to drive future growth of green bonds markets: successful implementation of the Paris Agreement, the success of green bond issues to date, tighter spreads compared to other bonds, and growing interest from emerging markets keen to grow local green bond markets.110 Green bonds could also benefit from investors’ growing desire to publicly demonstrate a commitment to the environment. There is potential as well for issuers in the US$600 billion unlabelled “green” bond market (where bond proceeds are invested in green projects but are not labelled green) to shift to issuing explicitly labelled green bonds. Integrating credit ratings and third-party “green” ratings could be a way to streamline the market and facilitate mainstreaming of green aspects in bond markets based on tools that private investors are familiar with.

YieldCos, which own portfolios of low-risk, long-term projects, are equity vehicles that can go a step further than bonds by effectively bundling equity and debt together in one package. By bundling projects together, the project finance premium for single projects can be avoided or reduced. The first renewables-focused YieldCos went public in 2013, though similar funds have existed for longer; in 2015 there were 15 renewables-focused YieldCos in the US, Canada and Europe, with a total market capitalisation of well over US$20 billion.111 The solar company SunEdison has also announced plans for a YieldCo focused on projects in emerging economy markets, with an initial portfolio consisting of solar, wind and hydropower projects, among others.

YieldCos and similar closed-end investment funds (the terminology varies across countries) are publicly-traded companies that own portfolios of operational renewable energy projects, paying dividends to shareholders from the projects’ revenues. Most funds aggregate solar and wind assets. Some also include hydropower, biomass and cogeneration assets. Most YieldCos have been created by renewable energy developers, selling their projects into the YieldCo upon completion. For an investor, a YieldCo or similar pooled investment vehicle can be a way to achieve the same cash flow that would come from directly owning a renewable energy project, but through a liquid, publicly traded instrument.

Because these instruments are exchange-traded, they avoid some of the liquidity risk and transaction costs associated with direct clean energy investments; they therefore have the potential to open up clean energy infrastructure investments to a wider range of investors, increasing the supply and reducing the cost of capital.

However, neither green bonds nor YieldCos are without drawbacks: as noted in Section 3, there are some questions about the extent of emission reductions from green bonds backed by larger institutions, and YieldCos do not yet have a long track record from which to judge their performance. Some of the larger YieldCos have developed an expectation of rapid future growth, making them possibly riskier investments. Still, the growing market for these instruments shows there is high demand among private investors for liquid investment opportunities in clean energy. Scaling up the use of pooled investment vehicles and extending their use across different markets and technologies appears to be a promising strategy to draw more private investment into clean energy.112

Boosting innovation investment

Investment in research, development and demonstration (RD&D) can encourage innovation, help to overcome incumbent technology advantage, and lower financial risks associated with investment in existing or new clean technology, thus reducing the upfront costs of energy infrastructure.113 Over the next 15 years, when key infrastructure systems will be built and locked in for decades, a pressing challenge is to rapidly deploy existing state-of-the-art technologies and business models or those that can rapidly be demonstrated at commercial scale, even as we also invest in next-generation technologies for the longer term.

There is an urgent need to scale up RD&D investment and create a culture of innovation across the energy system. Energy-sector public RD&D is less than half what it was in the late 1970s in real terms, and still often goes to fossil fuel exploration and production.114 Previous recommendations from the Global Commission were that R&D for clean energy should be tripled to well over US$100 billion a year by the mid-2020s.115 To be effective, a scaling up of R&D spending on clean energy should be accompanied by a phase-out of public R&D spending on fossil fuels.

Sustainable energy innovation requires significant expenditures and a wide variety of expertise, so investments here are particularly conducive to collaborative governance. Indeed, over the last two decades, the number of global public-private partnerships for energy RD&D has grown exponentially.116

Smart and collaborative R&D investments can be particularly powerful at the multi-country or global level. A long-standing example is the IEA’s Technology Collaboration Programmes (TCPs, also formerly called Implementing Agreements). There are now 39 TCPs, involving about 6,000 experts from government, industry and research organisations in 51 countries, covering a wide range of clean energy technologies and practices, including energy efficiency, renewable energy and energy storage or battery technologies as well as state-of-the-art fossil fuel and nuclear technologies.117 They develop and share knowledge across borders and identify and build on synergies in their research. Since 2007, non-IEA member countries, including China and India, have increased their participation.118

TCPs help achieve economies of scale and promote knowledge diffusion and collaboration.119 A recent analysis using nearly 40 years of patent data from 33 OECD countries found that bringing researchers together through TCPs boosts co-invention on wind and fuel cells, and especially on biofuels, solar photovoltaics and carbon capture and storage. What kinds of environmental policies are in place can also matter. Key features include stringency, predictability as well as flexibility – that is, policies that are not prescriptive but give firms incentives to look for the best technology solutions. 

Several other multi-partner, public-private global initiatives have recently launched and are working to boost R&D and deployment with climate change as a central theme. Examples include:

  • Mission Innovation, with 21 members (including Australia, the US, the UK, Brazil, Chile, China, the EU, Indonesia, India, Japan and Mexico) committing to doubling public investments in clean energy research and development over the next five years.120
  • Bill Gates’ Breakthrough Energy Coalition, which brings together 28 major individual investors from 10 countries, with a collective net worth of more than US$350 billion, to provide capital for research on high-risk but promising clean energy technologies.
  • The Global Innovation Lab for Climate Finance supports the identification and piloting of cutting-edge climate finance instruments that can drive investment and unlock new opportunities for renewable energy, energy efficiency, and adaptation efforts in developing countries. In just over a year of operation, it has already directed more than US$500 million to these areas in developing countries,and its model has been replicated to India with the India Innovation Lab for Green Finance.
  • Finance for Resilience (FiRe), managed by the Climate Policy Initiative, is a platform used to crowdsource funding for ideas that accelerate finance for clean energy, low-carbon infrastructure and sustainable cities. The platform targets large-scale ideas which aim to generate investment of over US$1 billion per year.

Bilateral collaborations are also making an impact. The US-China Renewable Energy Partnership, for example, was launched in 2009 to increase the deployment of renewable energy technologies, improve energy security, and expand business opportunities in both countries. Similarly, the US-India Partnership to Advance Clean Energy (PACE), also launched in 2009, has worked to decrease barriers to the deployment of wind and solar power, thus growing the Indian market for clean technologies and services. 121Building on this experience, in June 2016 the US and India announced a strengthened and expanded partnership to advance clean energy, including access to off-grid solar energy.122

In developing countries, decentralised renewable energy systems can far more rapidly bring modern energy services to rural areas and even to the urban poor than investment in a central grid. Efforts are needed to test and disseminate different business and finance models, such as pay-as-you-go solar, to learn what works best in each setting (see discussion in Section 4.2). Companies such as Tesla continue to push new clean technologies forward while social enterprises such as Mobisol, M-KOPA, Solar Now and Greenlight Planet123 accelerate rapid diffusion of new technologies and business models to finance them. Greater public-private collaboration can accelerate investments and diffusion, particularly in lower-income countries (see also discussion on impact investors below). The expanded use of patent pools, including financing and technical support for these, can also help to make low-carbon and climate-resilient energy technologies available to lower-income countries, and ensure they have the capacity to adopt and adapt them.124 Rather than belatedly adopting technologies developed elsewhere, often at significant expense, emerging and developing countries can seize the opportunity to develop their own, locally-adapted solutions, which can in turn help lower emissions, improve resilience and overcome poverty. As a form of South-South cooperation, solutions like mini-grid systems can be developed, exported, and shared with other developing countries.125

Leadership and investment from infrastructure corporations will also be essential to drive innovation, including in business models that can drive breakthroughs for rapid dissemination of new products and technologies and create new markets. Some emerging initiatives offer promise (see Box 23 below).

Box 23 — GE’s Ecomagination

GE’s Ecomagination is a striking example of corporate innovation in environmental sustainability. 2015 marked its 10th anniversary, with a cumulative US$17 billion in cleaner technology R&D spend that has generated US$232 billion in revenue while reducing corporate-wide GHG emissions by 12% and freshwater use by 17%.

126 The company has pledged to accelerate its actions to spend another US$10 billion in cleaner technology R&D by 2020 and achieve cumulative GHG emission and water reductions of 20%.

Ecomagination now includes a range of innovative partnerships, notably with Intel, Walmart, Masdar city, Statoil, Total, the mining and oil company BHP Billiton, and the water engineering company MWH Global. Many of these partnerships focus on reducing the emissions and energy intensity of industrial operations. In the case of Walmart, the goal is commercial applications at scale, where the partnership focuses on developing and demonstrating next-generation energy efficiency, renewables and digital solutions.

With results documented by an external auditor, the initiative has been more than just a research venture for clean energy and related digital technologies. Ecomagination has also helped to transform the company, setting out a vision that has helped to make it one of today’s leading green brands.

  1. Bhattacharya et al., 2016. Delivering on Sustainable Infrastructure for Better Development and Better Climate. Excludes investments in primary energy production (coal, oil) and investments in energy efficiency.

  2. Shearer, C., Ghio, N., Myllyvirta, L., Yu, A. and Nace, T., 2016. Boom and Bust 2016 Tracking the Global Coal Plant Pipeline. Coalswarm, Sierra Club and Greenpeace. LINK

  3. Nelson, D., et al., 2014. Moving to a Low Carbon Economy: The Impact of Different Policy Pathways on Fossil Fuel Asset Values. Climate Policy Initiative. LINK

  4. GCEC, 2014. Better Growth, Better Climate.

  5. IPCC, 2014. Climate Change 2014: Synthesis Report and SystemIQ. This corresponds to 260 billion tonnes (Gt) of CO2 emissions over their lifetimes, which in turn is over a quarter of the global carbon budget as estimated by IPCC to be consistent with a two-thirds chance of meeting the goal of limiting global mean temperature change to 2°C.

  6. See: LINK

  7. See Chapter 4 in Better Growth, Better Climate. GCEC, 2014. Based on IEA, 2013. Energy Efficiency Market Report 2013 – Market Trends and Medium Term Prospects. International Energy Agency, Paris. LINK

  8. IEA, 2015. Special Report on Energy and Climate Change. LINK

  9. Bishop, R., 2015. Raising Energy Efficiency Standards to the Global Best. Contributing paper for Global Commission on the Economy and Climate Synthesis Report 2015, Seizing the Global Opportunity: Partnerships for Better Growth and a Better Climate. LINK

    IEA, 2014. Capturing the Multiple Benefits of Energy Efficiency. International Energy Agency, Paris. LINK

  10. IEA, 2014. Capturing the Multiple Benefits of Energy Efficiency.

  11.  Kennedy and Corfee-Morlot, 2012 & 2013: Kennedy, C.A., & Corfee-Morlot, J. (2012) Mobilising Investment in Low- Carbon, Climate-Resilient Infrastructure. OECD Environment working paper 46; Kennedy, C.A., & Corfee-Morlot, J. (2013) Past Performance and Future Needs for Low-Carbon, Climate-Resilient Infrastructure – An Investment Perspective, Energy Policy, 59, 773-783.

  12. Association of American Railroads, 2015. Railroads and Coal. LINK

  13. Zukerman, J. et al., NCE Working paper, 2015. See also:

    CERES 2014. Investing in the Clean Trillion: Closing the Clean Energy Investment Gap

    CERES – BNEF 2016. Mapping the Gap – The Road from Paris. LINK

  14. Sierra Club and Oil Change International, 2016. Still Failing to Solve Energy Poverty: Internatinoal Public Finance for Distributed Clean Energy Access Gets Another “F”. LINK

  15. See: LINK

  16. CERES and Bloomberg New Energy Finance, 2016. Mapping the Gap: The Road from Paris. LINK

  17. See: LINK

  18. See: LINK

  19. See: LINK

  20. Co-chaired by France and Mexico, the G20 Energy Efficiency Finance Task Group gathers 14 countries in the aim to enhance capital flows for energy efficiency investments. In 2015, it developed Energy Efficiency Investment Principles, a policy framework to catalyse private investment in energy efficiency which was welcomed by all G20 energy ministers. The Principles focus on increasing the importance of energy efficiency in energy planning, unlocking specific market barriers for the supply and demand on energy efficiency finance, and building capacity of financial institutions. In parallel, the task group coordinates a global mobilization of the financial sector led by UNEP FI and its partners with over 110 banks and investors managing close to US$4 trillion of assets having committed to further integrate energy efficiency financing in their operations through two Energy Efficiency Statements.

    See: LINK

    See also: LINK

  21. OECD, 2016. Population Exposure to Fine Particles: Methodology and Results for OECD and G20 Countries, by Alexander Mackie, Ivan Haščič and Miguel Cárdenas Rodríguez; ENV/EPOC/WPEI(2015)5/FINAL.

    OECD, 2014. The Cost of Air Pollution: Health Impacts of Road Transport, OECD Publishing, Paris. LINK

  22. World Health Organization (WHO), 2014. Burden of Disease from Ambient Air Pollution for 2012. Geneva. LINK

  23. Ibid.

  24. Yuhas, A., 2016. Scientists: air pollution led to more than 5.5 million premature deaths in 2013. The Guardian, 12 February. Environment. LINK

  25. Chatterjee, P., 2015. Leave Delhi: That’s what doctors are prescribing to patients with serious respiratory ailments. The Indian Express, 2 April. LINK

  26. Health and Environment Alliance, 2013. The Upaid Health Bill: How Coal Plants Make Us Sick. LINK

  27. Analysis for GCEC, 2014. Better Growth, Better Climate showed that non-market costs, based on the value of a statistical life, can be up to 4.4% of GDP in the 15 largest economies.

    See also: OECD, 2016. The Economic Consequences of Outdoor Air Pollution, OECD Publishing, Paris. LINK

  28. OECD, 2016. The Economic Consequences of Outdoor Air Pollution, OECD Publishing, Paris. LINK

  29. These estimates are calculated using estimates of the individual willingness-to pay to reduce the risk of premature death and on results from studies valuing the willingness-to-pay to reduce health risks respectively.

  30. IRENA. 2016. The True Cost of Fossil Fuels: Saving on the Externalities of Air Pollution and Climate Change. International Renewable Energy Agency. LINK

  31. International Monetary Fund (IMF), 2015. IMF Survey : Counting the Cost of Energy Subsidies. LINK

  32. GCEC, 2014. Better Growth, Better Climate, Chapter 6. 

  33. There are a number of uncertainties in these numbers, including the relationship between pollution concentrations and health impacts, as well as the appropriate methodology and values used to monetise mortality and damage.

  34. IEA, 2015. Energy Subsidies. World Energy Outlook Resources. LINK

  35. OECD, 2015. Tracking Progress in reforming support for fossil fuels. OECD Companion to the Inventory of Support Measures for Fossil Fuels 2015. OECD Publishing, Paris. LINK

    Note: The OECD Inventory covers a broader range of measures than the IEA estimates, including many that do not reduce consumer prices below world levels. The Inventory uses a broad concept of support that encompasses direct budgetary transfers and tax expenditures that provide a benefit or preference for fossil-fuel production or consumption, either in absolute terms or relative to other activities or products. Both sets of estimates provide useful and complementary information.

  36. Coady, D., Parry, I., Sears, L. and Shang, B., 2015. How Large are Global Energy Subsidies?  IMF Working Paper, WP/15/105. International Monetary Fund, Washington, DC. LINK

  37. See the G7 Ise-Shima Leaders’ Declaration after the Ise-Shima Summit on 26–27 May 2016, p.28: “Given the fact that energy production and use account for around two-thirds of global GHG emissions, we recognize the crucial role that the energy sector has to play in combatting climate change. We remain committed to the elimination of inefficient fossil fuel subsidies and encourage all countries to do so by 2025.” LINK

  38. OECD Companion to the Inventory of Support Measures for Fossil Fuels. 2015. LINK

  39. See: LINK

  40. IMF, 2010. The Unequal Benefits of Fuel Subsidies: A Review of Evidence forDeveloping Countries. Arze del Granado, J., Coady, D., and Gillingham, R. LINK

    See also: ODI, 2015. Time to change the game: Fossil fuel subsidies and climate. Whitley, S. LINK

  41. IMF, 2015. The Unequal Benefits of Fuel Subsidies Revisited: Evidence for Developing Countries. Coady, D., Flamini, V., and Sears, L. LINK

  42. OECD, 2015. Statistical tables on official export credit support for transactions related to electric power generation (2003–2013). TAD/ECG(2015)10/FINAL. Organisation for Economic Co-operation and Development, Paris. LINK

  43. Rydge, J., 2015. Implementing Effective Carbon Pricing. Contributing paper for Seizing the Global Opportunity: Partnerships for Better Growth and a Better Climate. New Climate Economy, London and Washington, DC. LINK

  44. See: LINK

  45. Van der Burg, L. and S. Whitley, 2016. How you can stop the UK giving millions to dirty power? Blog, 17 May. Overseas Development Institute, London. LINK

  46.  Lontoh, L. Beaton, C. and Whitley, S. 2015. G20 Subsidies to Oil, Gas and Coal Production: Indonesia. Overseas Development Institute, London. LINK

  47. Touchette, Y. and Whitley, S. 2015. G20 Subsidies to Oil, Gas and Coal Production: Canada. Overseas Development Institute, London. LINK

  48. Whitley, S. and van der Burg, L. 2015. Fossil Fuel Subsidy Reform: From Rhetoric to Reality. New Climate Economy, Washington, DC. LINK

  49. The Times of India. 2016. Govt Doubles Clean Energy Cess on Coal to Rs 400 per tonne. Mumbai. LINK

  50. van der Burg, L. and Pickard, S., 2015. G20 Subsidies to Oil, Gas and Coal Production: Germany. Overseas Development Institute, London. LINK

  51. Ogarenko, I. Bossong, K. Gerasimchuk, I, Pickard, S. and Whitley, S. 2015. G20 Subsidies to Oil, Gas and Coal Production: Russia. Overseas Development Institute, London. LINK

  52. Kerr, S. 2015. Saudis Face Fuel Price Jump Under New Austerity Plan. Financial Times, London. LINK

  53. Whitley, S. and van der Burg, L. Fossil Fuel Subsidy Reform: From Rhetoric to Reality.

  54. Lewis, J. 2015. Brazil Announces Tax Increases for 2015. The Wall Street Journal, New York City. LINK

  55. Doukas, A. and Whitley, S. 2015. G20 Subsidies to Oil, Gas and Coal Production: United States. Overseas Development Institute, London. LINK

  56. Kitson, L. and Whitley, S. 2015. G20 Subsidies to Oil, Gas and Coal Production: France. Overseas Development Institute, London. LINK

  57. Rydge, 2015. Implementing Effective Carbon Pricing.

  58. World Bank Group and Ecofys, 2016. Carbon Pricing Watch 2016. Advance brief from the State and Trends of Carbon Pricing 2016 report. Washington, DC. LINK

  59. Felix, B., 2016. France leads by example with carbon price floor. Reuters, 17 May. LINK

  60. Platts, 2013. France adopts 2014 budget; carbon tax on fossil fuels. LINK

    The tax applied only to household heating fuels at first; it was extended to cover transport fuels in 2015, with an exemption for businesses covered by the EU ETS.

  61. Wingrove, J., 2016. Canada to introduce national carbon price in 2016, minister says. Bloomberg News, 15 July. LINK

  62. See: LINK

  63. World Bank Group and Ecofys, 2016. Carbon Pricing Watch 2016.

  64. The sample consisted of 146 IETA member representatives. See: IETA, 2016. IETA GHG Market Sentiment Survey 2016. 11th Edition. International Emissions Trading Association. LINK

  65. See: LINK

  66. Members of the Carbon Pricing Panel include German Chancellor Angela Merkel, Chilean President Michelle Bachelet, French President François Hollande, Ethiopian Prime Minister Hailemariam Desalegn, Philippines President Benigno Aquino III, Mexican President Enrique Peña Nieto, Canadian Prime Minister Justin Trudeau, Governor Jerry Brown of California, and Mayor Eduardo Paes of Rio de Janeiro.

  67. Parry, I.W.H., Heine, D., Lis, E. and Li, S., 2014. Getting Energy Prices Right: From Principle to Practice. International Monetary Fund, Washington DC. LINK

  68. Rodi, M., Schlegelmilch, K. and Mehling, M., 2012. Designing environmental taxes in countries in transition: a case study of Vietnam. In: Handbook of Research on Environmental Taxation, J.E. Milne and M.S. Anderson (eds.). Edward Elgar Publishing Limited, Cheltenham, UK. Chapter 7, 122–138.

  69. OECD, 2013. Taxing Energy Use: A Graphical Analysis. LINK

    (Note: an update was released on 25 June 2015.)

  70. OECD, 2013. Effective Carbon Prices.

  71. OECD, 2015. Policy Framework for Investment. Updated edition. Organisation for Economic Co-operation and Development, Paris. LINK

  72. OECD. 2015. Policy Guidance for Investment in Clean Energy Infrastructure: Expanding Access to Clean Energy for Green Growth and Development. Organisation for Economic Co-operation and Development, Paris. LINK

  73. OECD 2012. OECD Investment Policy Reviews: Colombia 2012. Organisation for Economic Co-operation and Development, Paris. LINK

  74. Ang et al. 2016 (forthcoming). Jordan Clean Energy Investment Policy Review. OECD Publishing, Paris. 

  75. The Arab Future Energy Index (AFEX) is a policy assessment and benchmark tool developed by Regional Center for Renewable Energy and Energy Efficiency (RCREEE) that provides a detailed comparison of renewable energy and energy efficiency development in 17 countries of the Arab region on more than 30 different indicators. LINK

  76. Nassiry, D., Barnard., S. and Nakhooda, S., 2016. Finding the pipeline: Project preparation and low-carbon investment. 

  77. Sinha, A., 2016. Union Budget 2016-17: Coal cess doubled to fund ministries, green drives. The Indian Express, 2 March. LINK

  78. Whitley S. and van der Burg, L., 2015. Fossil Fuel Subsidy Reform in Sub-Saharan Africa: From Rhetoric to Reality. New Climate Economy, London and Washington, DC. LINK

  79. OECD, 2014. Going Green: Best Practices for Green Procurement – Italy Integrated Energy Management Services. Organisation for Economic Co-operation and Development, Paris. LINK

  80. Eberhard, A., Kolker, J. and Leigland, J., 2014. South Africa’s Renewable Energy IPP Procurement Program: Success Factors and Lessons. Public-Private Infrastructure Advisory Facility, The World Bank, Washington, DC. LINK

  81. See: LINK

  82. IEA, 2014. Energy Efficiency Market Report 2014 – Market Trends and Medium-Term Prospects. International Energy Agency, Paris. LINK

  83. European Energy Efficiency Fund, 2015. Advancing Sustainable Energy for Europe. Annual Report 2015. LINK

  84. OECD, 2015. Green Investment Banks. Leveraging innovative public finance to scale up low-carbon investment. OECD Policy Perspectives. December 2015. LINK

  85. Smallridge, S., et al., 2013. The Role of National Development Banks in Catalyzing International Climate Finance. Inter-American Development Bank. LINK

  86. Bhattacharya et al., 2016. Delivering on Sustainable Infrastructure for Better Development and Better Climate.

    Meltzer, J. 2016. Financing Low Carbon, Climate Resilient Infrastructure: The Role of Climate Finance and Green Finance. Brookings.

  87. Energy efficiency sustainability premium is based on the percentage of construction costs that is required to attain a LEED platinum certification: 4.5–8.5%, according to a study by KEMA. LINK

  88. Bhattacharya et al., 2016. Delivering on Sustainable Infrastructure for Better Development and Better Climate.

  89. Wang, X., Stern, R., Limaye, D., Mostert, W. and Zhang, Y., 2013. Case study: Commercializing Energy Efficiency Finance (CEEF). In Unlocking Commercial Financing for Clean Energy in East Asia. The World Bank. 243–250. LINK

  90. IFC  [n.d.]. China Utility-Based Energy Efficiency Finance Program (CHUEE). LINK

  91. EBDR. Sustainable Energy Initiative. LINK

  92. See: LINK

  93. GCF, 2015. Consideration of funding proposals – Addendum Funding Proposal Summary for FP005. LINK 

  94. This box is based on information provided by EBRD.

  95. See the DAC Prize 2015 booklet LINK

    and the Fenix International website LINK

    and LINK

  96. See: LINK

  97. Africa Progress Panel, 2015. Power, People, Planet: Seizing Africa’s Energy and Climate Opportunities. LINK

    See also: LINK

  98. See: LINK

  99. The Climate Group, 2015. The Business Case for off-Grid Energy in India. Published in partnership with Goldman Sachs. LINK

  100. Banque Du Liban, BDL Environmental Loans. Financing Unit. LINK

  101. See: LINK

  102. Bielenberg, A., Kerlin, M., Oppenheim, J., and Roberts, M., 2016. Financing change: How to mobilize private sector financing for sustainable infrastructure. McKinsey Center for Business and Environment. LINK

  103. See: LINK

    Business Wire, 2015.  Wunder Capital Launches Wunder Bridge Fund to Help Investors Tap Into Booming Solar Market. LINK

  104. Climate Bonds Initiative, 2016. Bonds and Climate Change: The State of the Market 2016. Commissioned by HSBC. London. LINK

  105. Ibid.

  106. See also: OECD, 2015. Green Bonds: Mobilising the Debt Capital Markets for a Low-Carbon Transition. Policy Perspectives, published with Bloomberg Philanthropies. Organisation for Economic Co-operation and Development, Paris. LINK

  107. Climate Bonds Initiative, 2015. Bonds and Climate Change: The State of the Market in 2015. Commissioned by HSBC. London. LINK

  108. Wu, Y., 2016. BRICS New Development Bank to issue first yuan-denominated bonds. China Daily, 1 June. LINK

  109. The Climate Bonds Initiative lists a 10-point green bond agenda for the public sector. See: Climate Bonds Initiative, 2015. Bonds and Climate Change.

  110. Climate Bonds Initiative, 2015. 2015 Green Bond Market Update. Briefing for COP21. London. LINK

  111. Some examples of Yieldcos include NextEra Energy Partners, NRG Yield, Brookfield Renewable Energy Partners, TransAlta Renewables, Pattern Energy Group, Abengoa Yield PLC, Hannon Armstrong Sustainable Infrastructure, TerraForm Power, and TerraForm Global.

  112. Zuckerman, J., et al. Investing at Least a Trillion Dollars a Year in Clean Energy. A Contributing Paper for Seizing the Global Opportunity: Partnerships for Better Growth and a Better Climate. LINK

  113. IEA, 2015. Key Trends in IEA Public Energy Technology Research, Development and Demonstration (RD&D) Budgets. Fact sheet. International Energy Agency, Paris. LINK

  114. GCEC, 2014. Better Growth, Better Climate.

  115. Andonova, L. B., 2010. Public-private partnerships for the Earth: politics and patterns of hybrid authority in the multilateral system. Global Environmental Politics, 10(2). 25–53. DOI:10.1162/glep.2010.10.2.25.

  116. IEA. 2016. Technology Collaboration Programmes: Highlights and Outcomes, Paris. LINK

  117. Figueroa, A. 2010. Governance of International Co-Operation of Science, Technology and Innovation for Global Challenges. OECD Report DSTI/STP(2010)30.

  118. Haščič, I., Johnstone, N., and Kahrobaie, N., 2012. International Technology Agreements for Climate Change: Analysis Based on Co-Invention Data. OECD Environment Working Papers, No. 42. Organisation for Economic Co-operation and Development, Paris. LINK

  119. See: LINK

  120. See: LINK

  121. See White House factsheet: LINK

  122. See discussion Section 4.2 for more information on M-KOPA and Mobisol. For more information on Solar Now and Greenlight Plant, see: LINK

    and LINK

  123. Global Commission on the Economy and Climate, 2015. Seizing the Global Opportunity: Partnerships for Better Growth and a Better Climate. The 2015 New Climate Economy Report. Washington, DC, and London. LINK

  124. Ibid.

  125. See: LINK

    and: Haldemann, A., 2015. GE’s Ecomagination turns 10: How a brand can be a driver for change. The Huffington Post, 16 September. LINK

Next Section: Cities